
The four Chinese megabanks — Industrial and Commercial Bank of China, Agricultural Bank of China, China Construction Bank and Bank of China — retain their positions as the top four largest banks globally, with combined assets representing 14% of the total assets of the 1,000 largest banks. Together with US peers, they continue to dominate the global banking landscape, according to the 2025 TAB Global 1000 rankings based on 2024 financial statements with a 31 March 2025 cut-off.
This year’s ranking reflects a slowdown in global banking growth, with moderation in assets, loans and deposits largely driven by Asia Pacific and North American banks amid cautious lending and weak demand. Europe saw only a modest rebound, while the Middle East, Latin America and the Caribbean and Central Asia expanded faster. Despite slower growth, Chinese and US banks continue to dominate, while shifts in Japan and Europe were driven more by currency fluctuations rather than underlying growth.
Regional banking models vary significantly. Asia Pacific and Middle Eastern banks remain lending-driven, while North American institutions rely on diversification with lower loan dependence. Profitability in Asia Pacific, particularly in China and Japan, and in Europe remains constrained by structural pressures, while North American and Middle Eastern banks achieve higher profits relative to size, supported by strong margins, diversification and efficient funding. Latin America, Africa and Central Asia also report profit shares above asset shares, benefiting from higher lending margins.
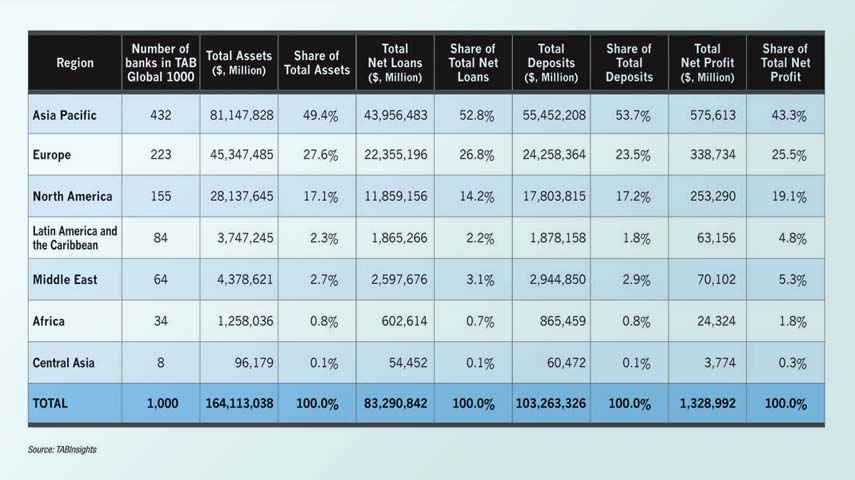
Collectively, the 1,000 largest banks held $164 trillion in total assets, $83 trillion in net loans and $103 trillion in customer deposits, while generating $1.33 trillion in net profit in FY2024. Asia Pacific accounts for the largest representation with 432 banks, followed by Europe with 223, North America with 155, Latin America and the Caribbean with 84, the Middle East with 64, Africa with 34 and Central Asia with eight.
This year’s assessment covers 100 countries, territories and special administrative regions — with adjustments to regional classification compared with last year — including 36 in Europe, 22 in Asia Pacific, 17 in Latin America and the Caribbean, 10 in the Middle East, 10 in Africa, three in Central Asia and two in North America.
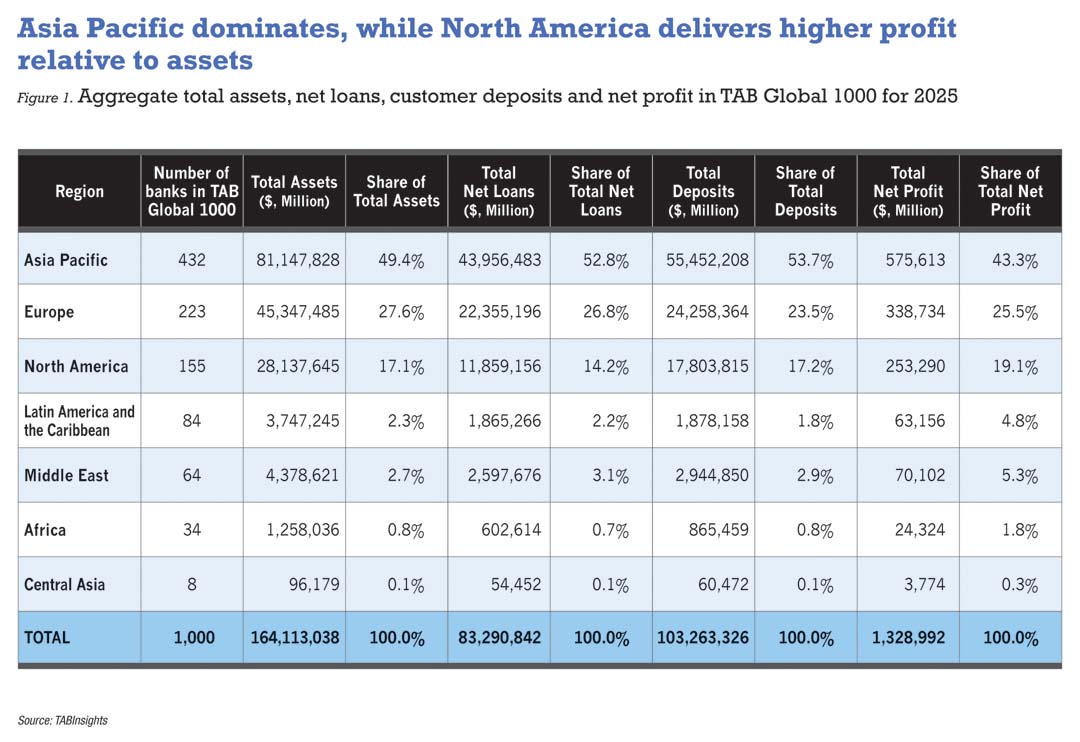
Asia Pacific dominates, North America delivers higher profit relative to assets
The regional breakdown of the 1,000 largest banks highlights the dominance of Asia Pacific, which holds 49.4% of their total assets, with the region’s top 10 banks alone accounting for 22% of total assets. Europe follows with 27.6% and North America with 17.1%, while other regions are much smaller in scale. The Middle East holds 2.7% of total assets, Latin America and the Caribbean 2.3%, Africa 0.8% and Central Asia 0.1%.
At a regional level, Asia Pacific and the Middle East remain more loan-driven, while North America operates with more diversified models and relatively lower reliance on lending. Asia Pacific accounts for 52.8% of global loans, above its share of assets, with lending remaining a primary income source. The Middle East also records loans above its asset share, with 3.1% of global loans compared to 2.7% of assets. North America, by contrast, holds 17.1% of assets but only 14.2% of loans, indicating a more diversified asset base with greater contributions from securities and trading activities. Europe, with 27.6% of assets and 26.8% of loans, is relatively balanced, with lending slightly below its asset share and complemented by other banking activities.
Despite holding 49.4% of global banking assets, Asia Pacific contributes only 43.3% of global profit, with the largest divergence in assets and profitability shown by Japan and China. Japan’s prolonged profit pressure stems from ultra-low net interest margins (NIM) of around 0.7% and sluggish corporate loan growth, as an ageing population curbs investment and expansion. In China, profitability is limited by policy-driven lending and interest controls that force loans at lower rates, with margins further reduced by benchmark cuts. Weak credit demand from cautious borrowers restrains income, while high digital transformation costs weigh on near-term profits. Structural issues including fierce competition and lingering non-performing loans further drag returns.
Europe shows a similar trend, with a 25.5% profit share trailing its 27.6% asset share, constrained by narrow margins, subdued balance sheet growth and high costs. Negative rate legacies and soft credit demand curb loan pricing, while regulation, branch networks and restructuring add to cost pressures.
North America generates 19.1% of global profit from 17.1% of assets, led by US banks, while Canadian banks’ profit share fell below asset share in FY2023 amid narrowed NIMs and higher provisions.. US banks benefit from higher-rate lending and diversified portfolios, operating in competitive markets with flexible pricing and multiple funding channels. Canadian banks, by contrast, operate in lower-rate environments, focus on low-risk mortgages, rely on retail deposits, and face stricter regulations. Meanwhile, US banks — especially large institutions — benefit from diversified revenues, including investment banking, wealth management and trading. Despite cost pressures, economies of scale and digital transformation help contain cost-to-income ratios.
The Middle East accounts for 5.3% of global profit from 2.7% of assets, driven by strong funding, profitable lending and efficiency. Banks rely on large, stable deposits, including from government-related entities and wealthy households, with high current and savings account shares keeping costs low. Latin America and the Caribbean, Africa and Central Asia likewise post profit shares above assets on high margins.
Dominance of Chinese and US banks
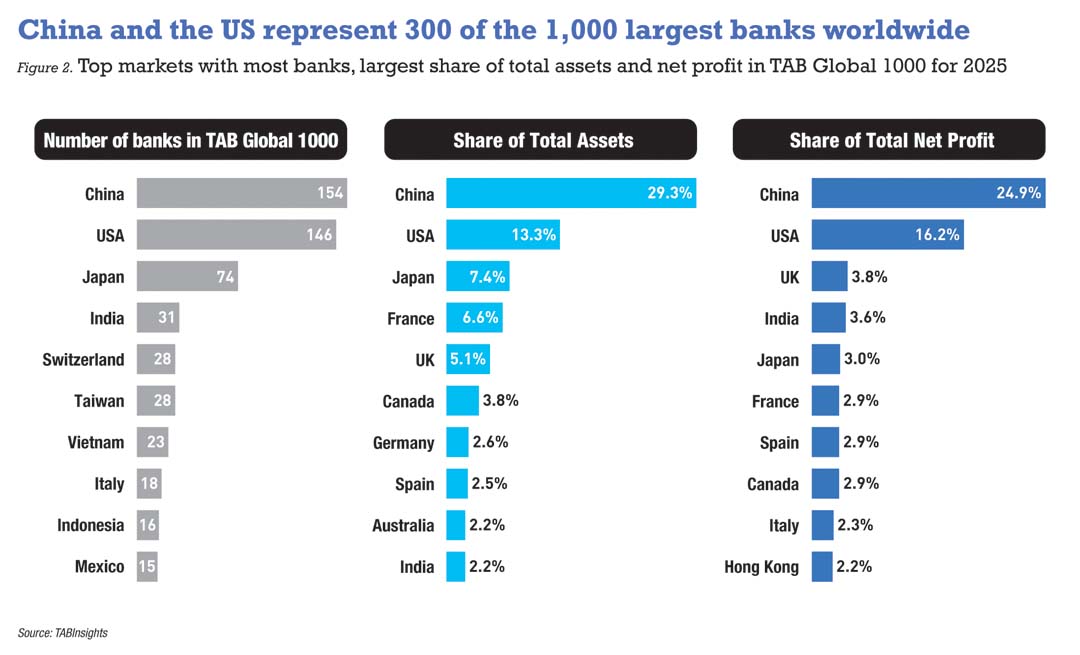
China has the largest representation with 154 banks, followed by the US with 146, Japan with 74 and India with 31. Chinese banks hold 29.3% of the combined assets of the 1,000 largest banks, versus 13.3% for US peers, and contribute 24.9% of global profit compared with 16.2% for US banks.
France, despite only comprising seven banks in the ranking, contributes 6.6% of total assets and 2.9% of net profit. Similarly, the United Kingdom (UK), with 10 banks, represents 5.1% of total assets and 3.8% of net profit. Canada, with nine banks, accounts for 3.8% of total assets and 2.9% of net profit, while Spain, also with nine banks, contributes 2.5% of total assets and 2.9% of net profit.
Japan’s 74 banks in the ranking together account for 7.4% of total assets but generate only 3% of net profit. Switzerland and Taiwan, each with 28 banks, contribute 1.8% and 1.3% of total assets, alongside 0.9% and 1% of net profit, respectively. Meanwhile, Vietnam’s 23 banks represent a mere 0.5% of total assets and 0.8% of aggregate net profit.
Several markets, including Japan, China, France, Germany and the UK, report profit shares below their asset shares, indicating weaker profitability. In contrast, markets such as the US, India, the United Arab Emirates (UAE) and Saudi Arabia report profit shares above asset shares, reflecting stronger returns. Indian banks, with 2.2% of assets and 3.6% of net profit, benefit from economic growth and reforms, while improved asset quality reduced provisioning. The UAE and Saudi Arabia each account for 0.7% of assets and 1.6% of profit.
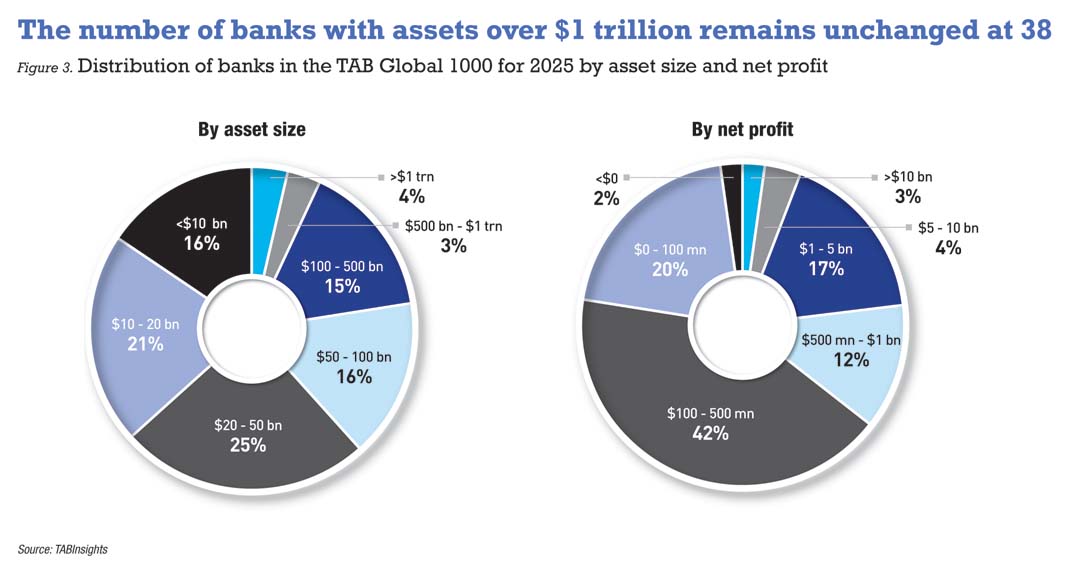
Trillion-dollar banks hold steady as mid-tier segments expand
The number of banks with total assets above $1 trillion remained unchanged at 38, comprising 16 banks from Asia Pacific, 12 from Europe and 10 from North America. Bank of Montreal in Canada entered the group, rising from $970 billion in FY2023 to $1.01 trillion in FY2024, while Intesa Sanpaolo, Italy’s largest bank, fell below the threshold as its total assets dropped from $1.07 trillion to $966 billion, mainly due to a reduction in cash and balances with central banks.
In addition, 33 banks held assets between $500 billion and $1 trillion, two more than last year, while 154 banks reported assets in the $100 billion to $500 billion range, up by 10 from the previous year. A total of 620 banks had assets between $10 billion and $100 billion, down from 641, and 155 banks recorded assets below $10 billion.
On profitability, 24 banks posted net profits exceeding $10 billion, up from 21 the previous year. This group includes 10 from Asia Pacific and seven each from Europe and North America. Meanwhile, 209 banks earned between $1 billion and $10 billion, compared with 197 last year, while 542 banks reported net profits of $100 million to $1 billion, down slightly from 547. In addition, 21 banks recorded net losses, one more than the previous year.
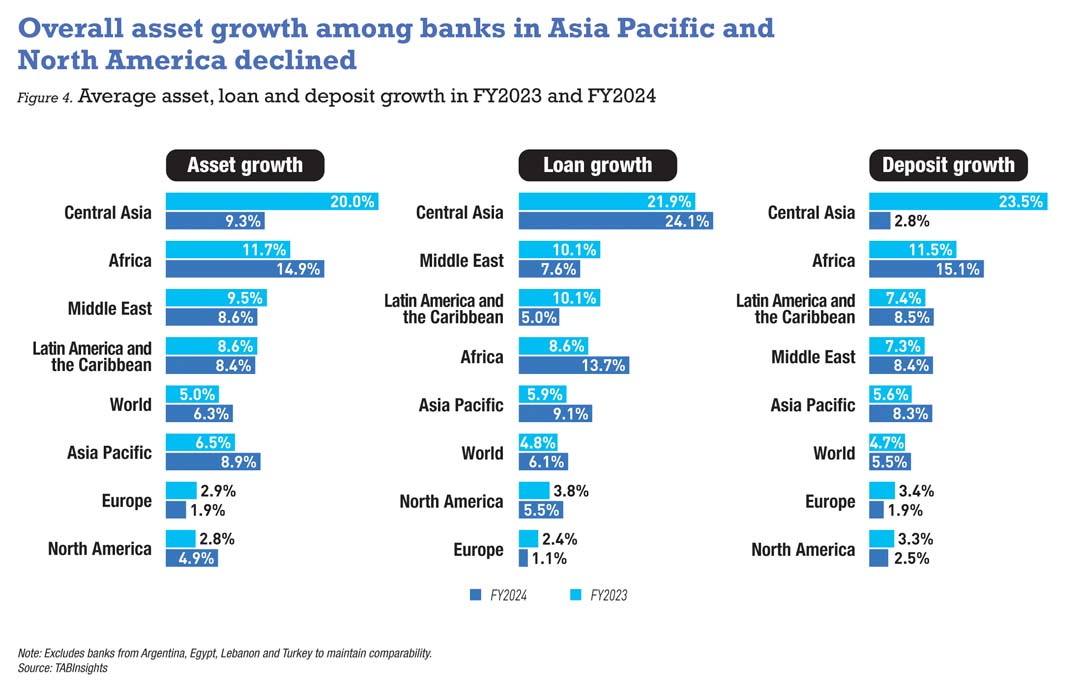
Global asset growth slows as Asia Pacific, North America decelerate
Global banking activity slowed in FY2024 as weighted-average asset growth fell to 5.0% from 6.3% a year earlier. Loan expansion eased to 4.8% from 6.1%, while deposit growth moderated to 4.7% from 5.5%. These figures exclude banks in Argentina, Egypt, Lebanon and Turkey, where inflation, currency volatility and economic instability distort comparability. The slowdown was driven mainly by Asia Pacific and North America, with some moderation in Africa.
In Asia Pacific, assets grew 6.5% in FY2024, down from 8.9% in FY2023. Loan growth slowed to 5.9% from 9.1%, while deposits rose 5.6% versus 8.3% previously. In China, asset growth moderated from 11.3% to 7.5% and loan growth from 11% to 8%, reflecting subdued corporate and consumer lending demand, cautious credit policies and regulatory prudence, while rising asset quality pressures also strained balance sheets. Japan saw a slowdown in asset expansion from 5.6% to 1.8%, while India moderated from 13% to 10.9%. Malaysia and Thailand also recorded slower momentum, while the Philippines, Singapore, South Korea, Taiwan and Vietnam benefited from stronger lending and deposit trends.
North American banks registered the weakest asset growth globally, slowing from 4.9% in FY2023 to 2.8% in FY2024. US assets expanded just 2%, down from 4.8%, while Canadian banks edged down slightly from 5.5% to 5.4%. The deceleration reflects tighter monetary conditions, elevated interest rates, cautious lending and regulatory pressures to strengthen capital and liquidity.
European banks rebounded modestly, with average growth rising from 1.9% to 2.9%. Large institutions, including BNP Paribas, Deutsche Bank, ING, NatWest, Nordea and UniCredit, achieved stronger expansion over the period. Nevertheless, overall balance sheet growth remained constrained, reflecting a cautious approach amid persistent macroeconomic uncertainties.
In the Middle East, banks experienced faster growth, supported by government-backed investment projects. Average asset growth rose from 8.6% to 9.5%, while loan growth climbed 7.6% to 10.1%. This expansion is largely structural, driven by state-led economic diversification plans, large-scale infrastructure projects and robust corporate financing demand. Saudi asset growth surged from 9.7% to 13.9%, while Qatar and Kuwait rose to 4.7% from 3.5% and 3.3%, respectively, reflecting sustained government support.
Latin America and the Caribbean also saw moderate acceleration, with the average asset growth rate edging up to 8.6% from 8.4%. Loan growth jumped to 10.1% from 5.0%, outpacing deposits, which slowed to 7.4% from 8.5%, highlighting stronger credit-driven momentum.
Central Asia and Africa posted the strongest balance sheet expansion, with growth of 20% and 11.7% respectively. In Central Asia, rapid economic growth, rising investment and deeper financial inclusion supported the expansion. In Africa, banking activity remained resilient, although progress slowed for some institutions amid high interest rates, currency volatility and rising credit risks.
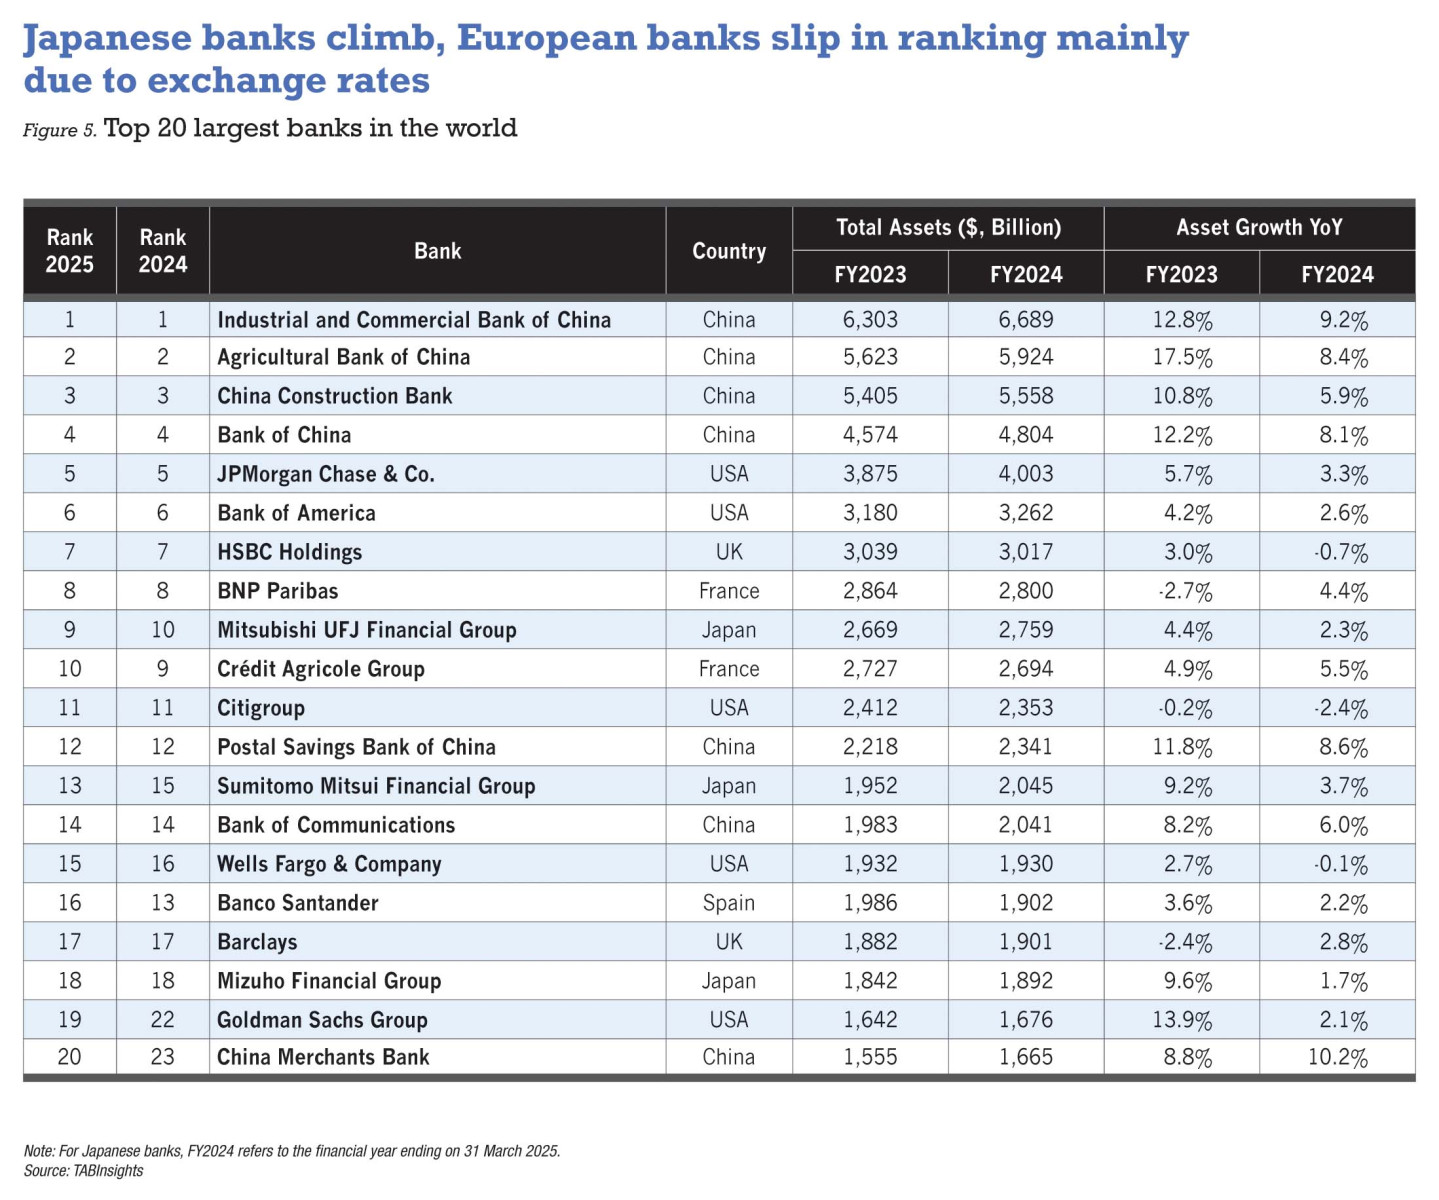
Chinese megabanks extend lead over US peers among top 20
The world’s 20 largest banks comprise seven from China, five from the US, three from Japan, two from France, two from the UK and one from Spain. Industrial and Commercial Bank of China leads with $6.69 trillion of assets, followed by Agricultural Bank of China ($5.92 trillion), China Construction Bank ($5.56 trillion) and Bank of China ($4.80 trillion). These four Chinese giants saw asset growth ranging from 5.9% to 9.2% in FY2024, down from a range of 10.8% to 17.5% in FY2023, reflecting weak credit demand, narrowing margins and rising asset quality pressures. They are diversifying into non-interest income to offset lower lending returns.
JPMorgan Chase and Bank of America remain the fifth and sixth largest banks globally, with assets up 3.3% and 2.6%, respectively, slower than FY2023 when their assets grew 5.7% and 4.2%. Citigroup maintained its 11th place despite a 3% contraction, while Wells Fargo edged up from 16th to 15th, despite its total assets falling by 0.1% in FY2024.
The gap between Chinese and US leaders widened further, with Industrial and Commercial Bank of China’s assets 67% larger than JPMorgan Chase’s, up from 63% in FY2023 despite renminbi (RMB) depreciation.
In Europe, HSBC ($3.0 trillion in assets) and BNP Paribas ($2.8 trillion) remain the seventh and eighth largest banks. Crédit Agricole slipped from ninth to 10th place — overtaken by Mitsubishi UFJ Financial Group, which rose from 10th despite slower asset growth (2.3%) compared with Crédit Agricole’s 5.5%. The shift was helped by yen (JPY) appreciation against the euro. Sumitomo Mitsui Financial Group rose from 15th to 13th, while Banco Santander fell from 13th to 16th, with asset growth of 2.2%.
Société Générale and UBS exited the top 20, replaced by Goldman Sachs and China Merchants Bank, the latter posting the strongest growth among the top 20, with assets up 10.2% to $1.66 trillion.
Asset growth, FX reshape Asia Pacific rankings
The top 10 largest banks in Asia Pacific were unchanged from last year, except for Sumitomo Mitsui Financial Group overtaking Bank of Communications for seventh place. The shift reflected currency movements, as Bank of Communications grew assets 6% in FY2024 while Sumitomo Mitsui Financial Group’s assets rose 3.7%.
State Bank of India overtook Commonwealth Bank of Australia as the 18th largest in the region and 42nd globally, lifting assets 8.6% (FY2024 ending 31 March 2025) to $856 billion, compared with just 0.1% growth for Commonwealth Bank of Australia.
Banks in Pakistan and Vietnam climbed on robust asset growth, while peers in South Korea and Taiwan slipped due to currency depreciation. Thai banks also lost ground as asset growth remained weak. Bangkok Bank, Kasikornbank, Krung Thai Bank and Siam Commercial Bank saw assets rise by only 0.8%, 1.3%, 1.8% and 0.8%, respectively, while Bank of Ayudhya, TMBThanachart Bank, Kiatnakin Phatra Bank and TISCO Bank all contracted.
Europe’s banking giants consolidate with modest growth
HSBC, BNP Paribas, Crédit Agricole, Banco Santander and Barclays are Europe’s five largest banks. Groupe BPCE overtook Société Générale and UBS to place sixth, with total assets growing by 2.6% compared with 1.3% for Société Générale. Deutsche Bank and Crédit Mutuel remain ninth and 10th in the region. Among the top 10 largest banks, Deutsche Bank and Crédit Agricole recorded the fastest asset growth in FY2024, at 5.7% and 5.5%, respectively.
The largest banks from Austria, Belgium, Denmark, Finland, France, Germany, Italy, the Netherlands, Russia, Spain, Sweden, Switzerland and the UK all feature in the global top 100. ING Group from the Netherlands and Intesa Sanpaolo from Italy rank 12th and 13th in the region, respectively. Nordea Bank from Finland is 22nd, Danske Bank from Denmark 25th, Erste Group Bank from Austria 29th and Skandinaviska Enskilda Banken from Sweden 31st.
US banks hold scale advantage as Canada closes gap
North America’s top 10 largest banks remain unchanged from last year, comprising six from the US and four from Canada, all with assets above $1 trillion at the end of FY2024. In total, 18 North American banks rank among the world’s top 100 largest banks, led by JPMorgan Chase, Bank of America and Citigroup.
Royal Bank of Canada remains the country’s largest lender, ranking sixth in North America and 25th globally. It overtook Toronto-Dominion Bank in FY2023, and the gap widened in FY2024, as Royal Bank of Canada increased assets by 8.2% to $1.56 trillion, while Toronto-Dominion Bank posted 5.5% growth to $1.48 trillion.
US banks continue mergers and acquisitions to gain scale, reduce costs, share technology and enhance competitiveness. Deals included UMB Financial’s purchase of Heartland Financial, SouthState’s acquisition of Independent Bank Group, Atlantic Union Bank’s acquisition of Sandy Spring Bancorp, Mechanics Bank’s acquisition of HomeStreet and WesBanco’s acquisition of Premier Financial.
Brazilian heavyweights lead Latin America’s banking landscape
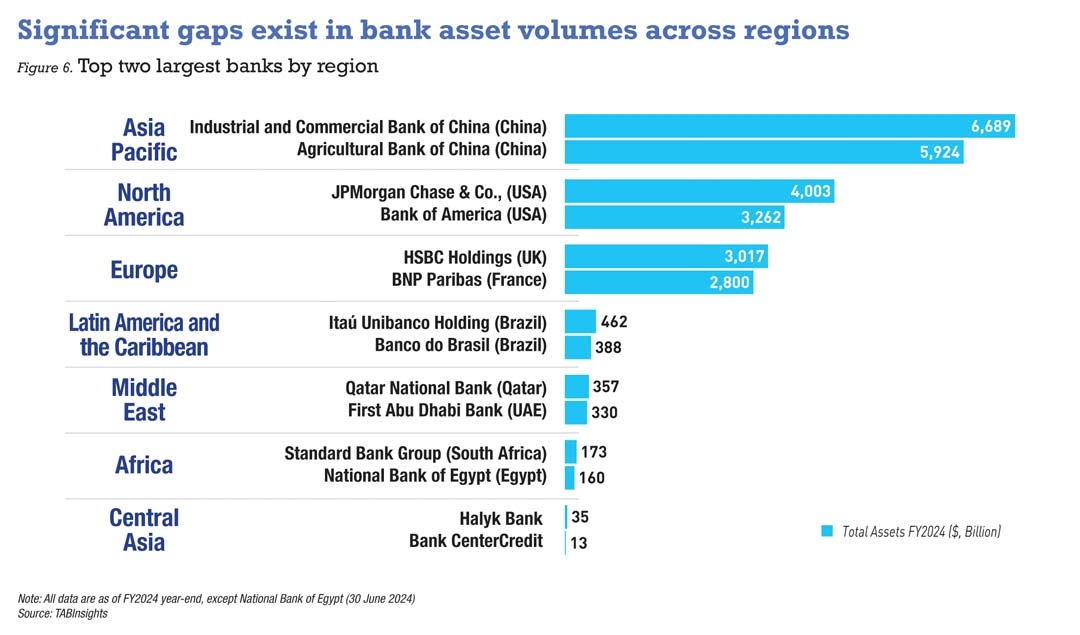
The top 10 largest banks in Latin America and the Caribbean comprise five from Brazil, three from Mexico and one each from Chile and Colombia. Itaú Unibanco Holding, Banco do Brasil and Banco Bradesco remain the three largest in the region, all ranking among the global top 100. Itaú Unibanco’s total assets rose steadily, up 12.2% in FY2022, 9.6% in FY2023 and 12.2% in FY2024, reaching $462 billion at the end of 2024.
BBVA Mexico, the country’s largest bank, ranks sixth in the region and 157th globally, with total assets up 8% to $175 billion in 2024. Bancolombia, the largest bank in Colombia, ranks ninth in the region. Following its 2025 restructuring, Bancolombia now operates as a standalone bank under Grupo Cibest, a Colombian financial conglomerate formed in May 2025. Banco de Crédito e Inversiones, Banco de Crédito del Perú and Banco de la Nación Argentina remain the largest banks in Chile, Peru and Argentina, ranking 10th, 13th and 17th in the region.
Qatar leads Middle East, Saudi and UAE gain ground
Qatar National Bank remains the largest in the Middle East, with total assets rising 5.4% to $357 billion in FY2024. The region’s top 10 include three from the UAE, three from Israel, two from Saudi Arabia and one each from Kuwait and Qatar. First Abu Dhabi Bank and Saudi National Bank retain second and third place, while both Qatar National Bank and First Abu Dhabi Bank are also among the world’s top 100.
National Bank of Kuwait overtook Kuwait Finance House to claim 10th place. Total assets of Kuwait Finance House declined 3.4% in FY2024, mainly due to the sale of KFH-Bahrain to Al Salam Bank in May 2024 and foreign exchange fluctuations, while National Bank of Kuwait grew 7.1% on the back of solid performance across its business lines.
Among the top 10 largest banks in the region, Al Rajhi Bank recorded the fastest asset growth at 20.6% in FY2024, driven by strong expansion in both financing and investment portfolios, followed by Emirates NBD at 15.5% and Abu Dhabi Commercial Bank at 15.1%.
The largest bank in most countries in the region remains unchanged, except in Kuwait and Bahrain. In Bahrain, Arab Banking Corporation replaced Gulf International Bank as the largest bank. Total assets of Gulf International Bank fell 8.7% in FY2024 due to a decline in transitory client deposits tied to cash management and payment services in the UK.
South Africa’s Standard Bank anchors region
The top 10 largest banks in Africa are heavily influenced by exchange rate movements. The list includes four from South Africa, three from Morocco, two from Egypt and one from Togo. Standard Bank Group remains the largest in the region, with total assets rising 7.3% to $173 billion at the end of FY2024, ranking 149th globally. National Bank of Egypt is second, with total assets in USD terms falling from $169 billion at the end of 2023 to $160 billion in 2024 due to the sharp depreciation of the Egyptian pound against the US dollar.
Attijariwafa Bank, the largest in Morocco, ranks seventh in the region, with total assets increasing 10.2% to $72 billion in FY2024. Ecobank Transnational, headquartered in Togo, moved up to 10th place, overtaking Access Holdings of Nigeria. Total assets of Access Holdings in USD fell from $30 billion in 2023 to $27 billion in 2024, as the naira underwent a steep depreciation.
Kazakhstan drives Central Asia’s growth through retail lending
With $35 billion in assets at the end of FY2024, Halyk Bank is the largest bank in Central Asia, ranking 479th globally. Eight banks from the region entered the global top 1000, including four from Kazakhstan and two each from Azerbaijan and Uzbekistan. The National Bank of Uzbekistan and the International Bank of Azerbaijan rank third and fourth in the region.
Kazakhstan’s banking sector recorded strong growth, driven by lending expansion largely in the retail segment. In FY2024, total assets of Halyk Bank, Bank CenterCredit, ForteBank and Alatau City Bank rose by 19.7%, 33.6%, 25.8% and 20.3% respectively. Retail lending growth in the country is expected to moderate as regulators introduce measures to curb overheating risks in consumer finance.
Overall, the 2025 TAB Global 1000 largest banks ranking highlights the continued dominance of Chinese and US institutions amid slower global growth, with pronounced regional differences in business models, performance and resilience. Global banking remains shaped by structural challenges, diverse strategies and evolving market conditions, pointing to a period of measured yet selective expansion worldwide.
What is TAB Global 1000?
TAB Global 1000 is an annual study of the financial and business performance of the banking industry in the world. The study comprises two different lists: the first ranks the top 1,000 banks in the world by asset size, while the second ranks the same 1,000 banks by strength of their balance sheets, an evaluation that is based on a belief that a strong bank demonstrates long-term profitability from its core businesses.
Which banks are included?
The assessment covers both banks and financial holding companies with significant activity in banking. The evaluation does not include central banks, policy banks or finance companies.
How do we collect and treat the data?
Bank annual reports are our main sources of data. In the absence of up-to-date annual reports, we contact banks directly to source financial results for the financial year 2024, with a March 2025 cutoff. Consolidated figures are used for banking groups, except when non-banking activities form a substantial portion of the consolidated figures, in which case we look at the banking unit independent of its parent. All figures are quoted in United States dollars. Year-on-year growth rates are calculated based on original local currency figures.